In any Outputted Format
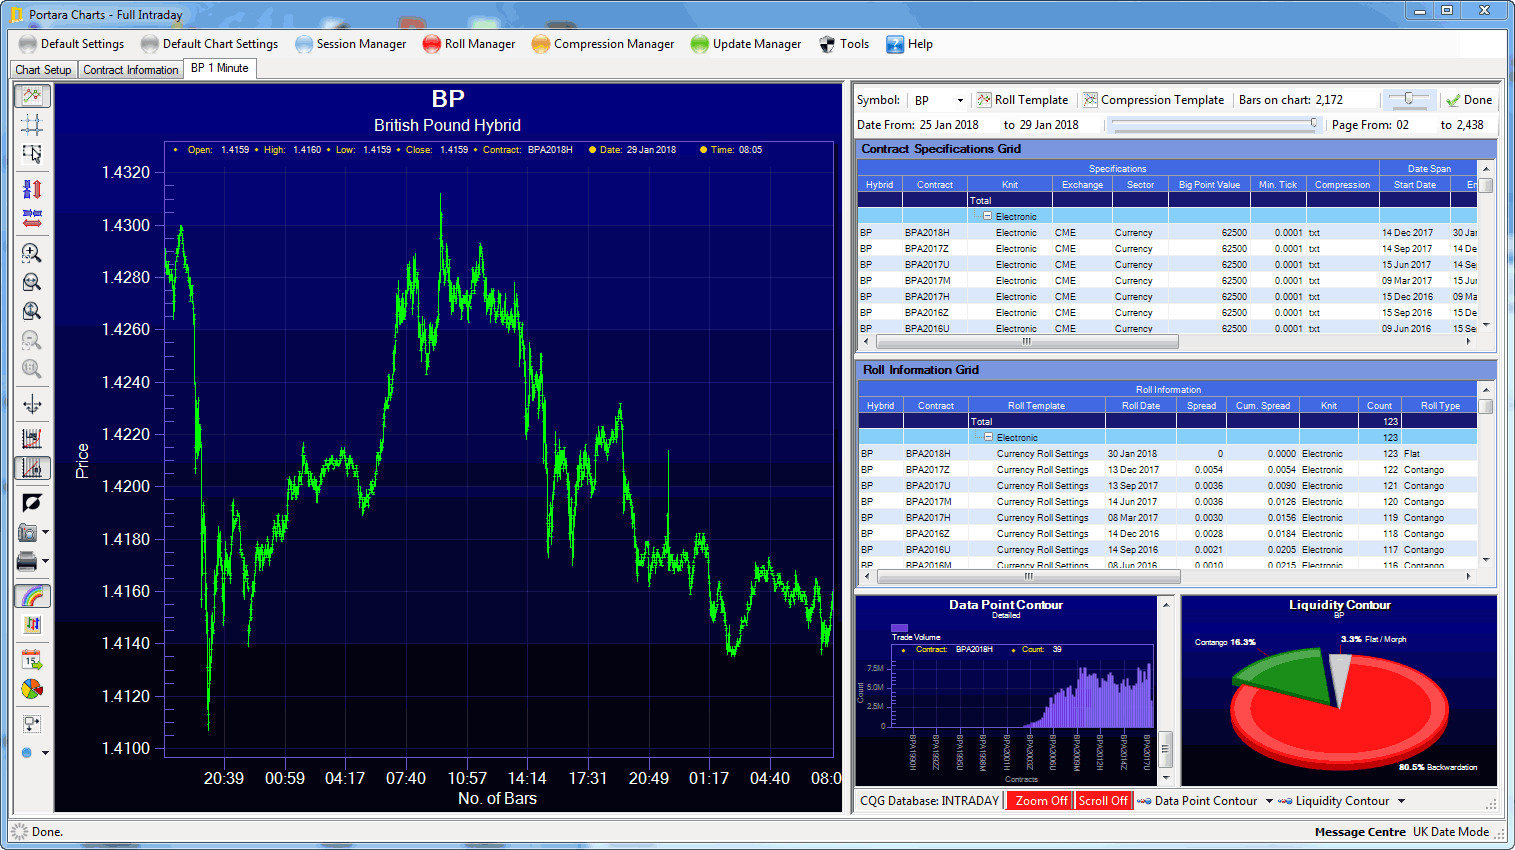
Portara Charts has been designed to interact optimally with a double monitor setup, but a double monitor is not necessary. This is so you are able to visualise the chart experience on the left whilst looking at the analysis section on the right. Above to the left hand side you can see a data snapshot of a British Pound continuous, compressed file from CQG Data Factory and to the right the analysis.
As an example of scale of 1 minute data, say if we wished to display BP from 1974 to 2010 on a single chart at 1 minute frequency. There is simply too much data to make the rendering process viable in one chart. Portara Charts has designed the rendering algorithms to be extremely fast. There is a scrolling facility which allows the user to set default number of bars to display as each page of the chart is rendered. The user experience is seamless and very fast.
As an example, BP from 1974 to 2010 has approximately 6 million 1 minute bars of data in its continuous 1 minute stream. Rendering at 5000 bars per view would mean that there are literally 1300 charts to scroll through to see the entire instrument history. Drag and drop scrolling, coarse and fine are all user friendly and lightening fast to use. You have full control over the number of bars to view per page.